

| I | Attachment | History | Action | Size | Date | Who | Comment |
|---|---|---|---|---|---|---|---|
| |
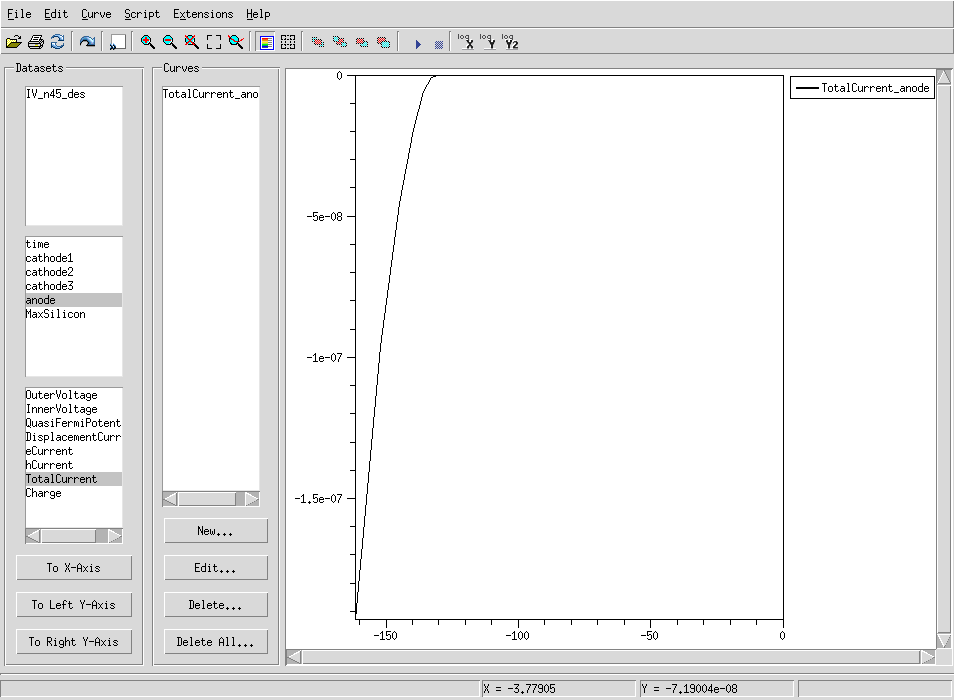
iv_break.png | r1 | manage | 8.7 K | 2020-05-21 - 03:11 | AtlasjSilicon | |
| |
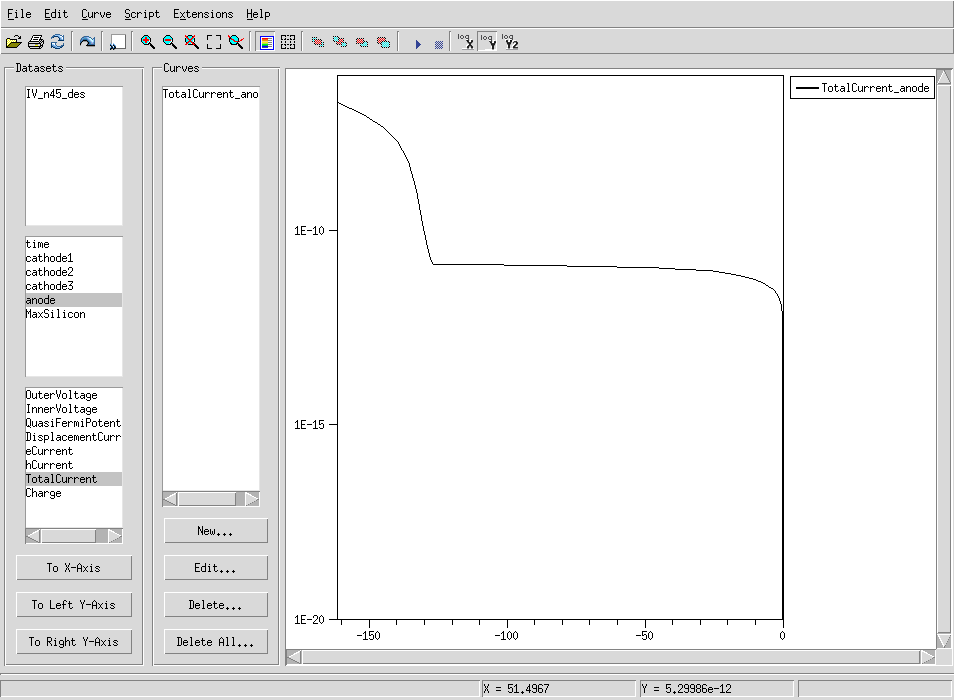
iv_break_ly.png | r1 | manage | 8.5 K | 2020-05-21 - 03:15 | AtlasjSilicon |
This topic: Main > TCADSimulationInformation > Tutorial4thTCADWorkshop > Tutorial7thTCADDay3
Topic revision: r1 - 2020-05-21 - AtlasjSilicon
Ideas, requests, problems regarding TWiki? Send feedback