3日目(デバイスシミュレーション)
前回のSimple2Dの例題を走らせてみる。
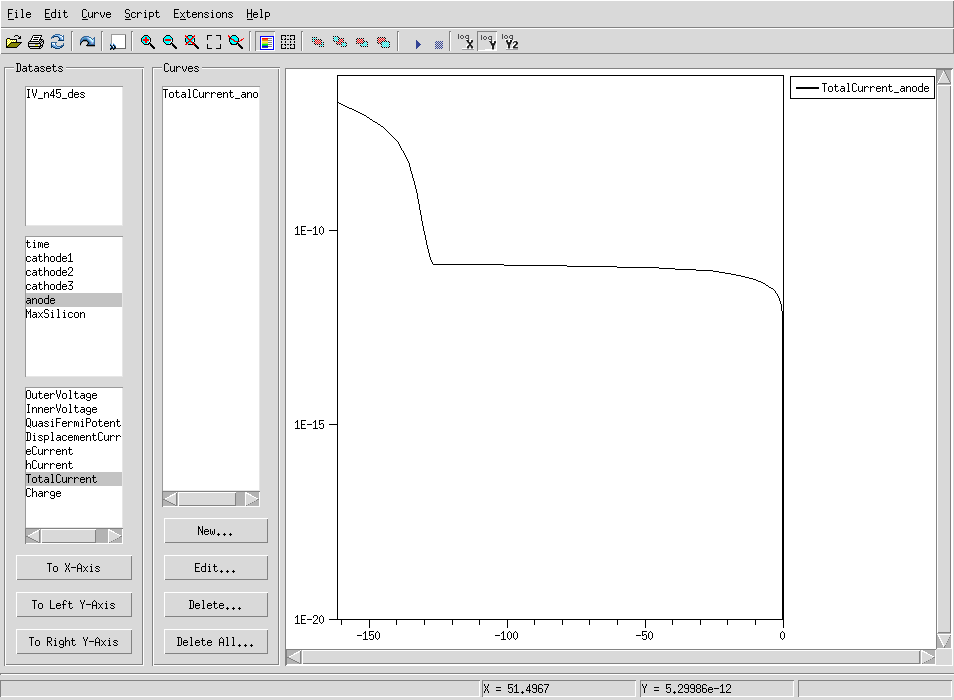
まずは、Simple2Dのプロジェクトを開いてください。cd ~/work/Silicon/TCAD/Sentaurus/tutorials/Simple2D swb . &node 27だけ実行してあったと思います。 その構造に相当するIVシミュレーション(node 45)も実行して前回同様、Inspectorを使ってIV_n45_des.plt を開いてみてください。 anodeの OuterVoltage をx軸に、anodeのTotalCurrentをy軸に指定してプロットを描くとしたの図のようになります。
 最初の例題で見たグラフとずいぶん違う形になっていますが、これは130V付近で電場の集中による雪崩増幅が起こったことを示唆しています。
Y軸をログスケールにするともう少しわかりやすいかもしれません。上の方真ん中付近にある logYというボタンを押してみてください。
最初の例題で見たグラフとずいぶん違う形になっていますが、これは130V付近で電場の集中による雪崩増幅が起こったことを示唆しています。
Y軸をログスケールにするともう少しわかりやすいかもしれません。上の方真ん中付近にある logYというボタンを押してみてください。
 --
-- 

| I | Attachment | History | Action |
Size | Date | Who | Comment |
|---|---|---|---|---|---|---|---|
| |
iv_break.png | r1 | manage | 8.7 K | 2020-05-21 - 03:11 | AtlasjSilicon | |
| |
iv_break_ly.png | r1 | manage | 8.5 K | 2020-05-21 - 03:15 | AtlasjSilicon |
Topic revision: r1 - 2020-05-21 - AtlasjSilicon

Ideas, requests, problems regarding TWiki? Send feedback